


Value Chain of Telecom Industry
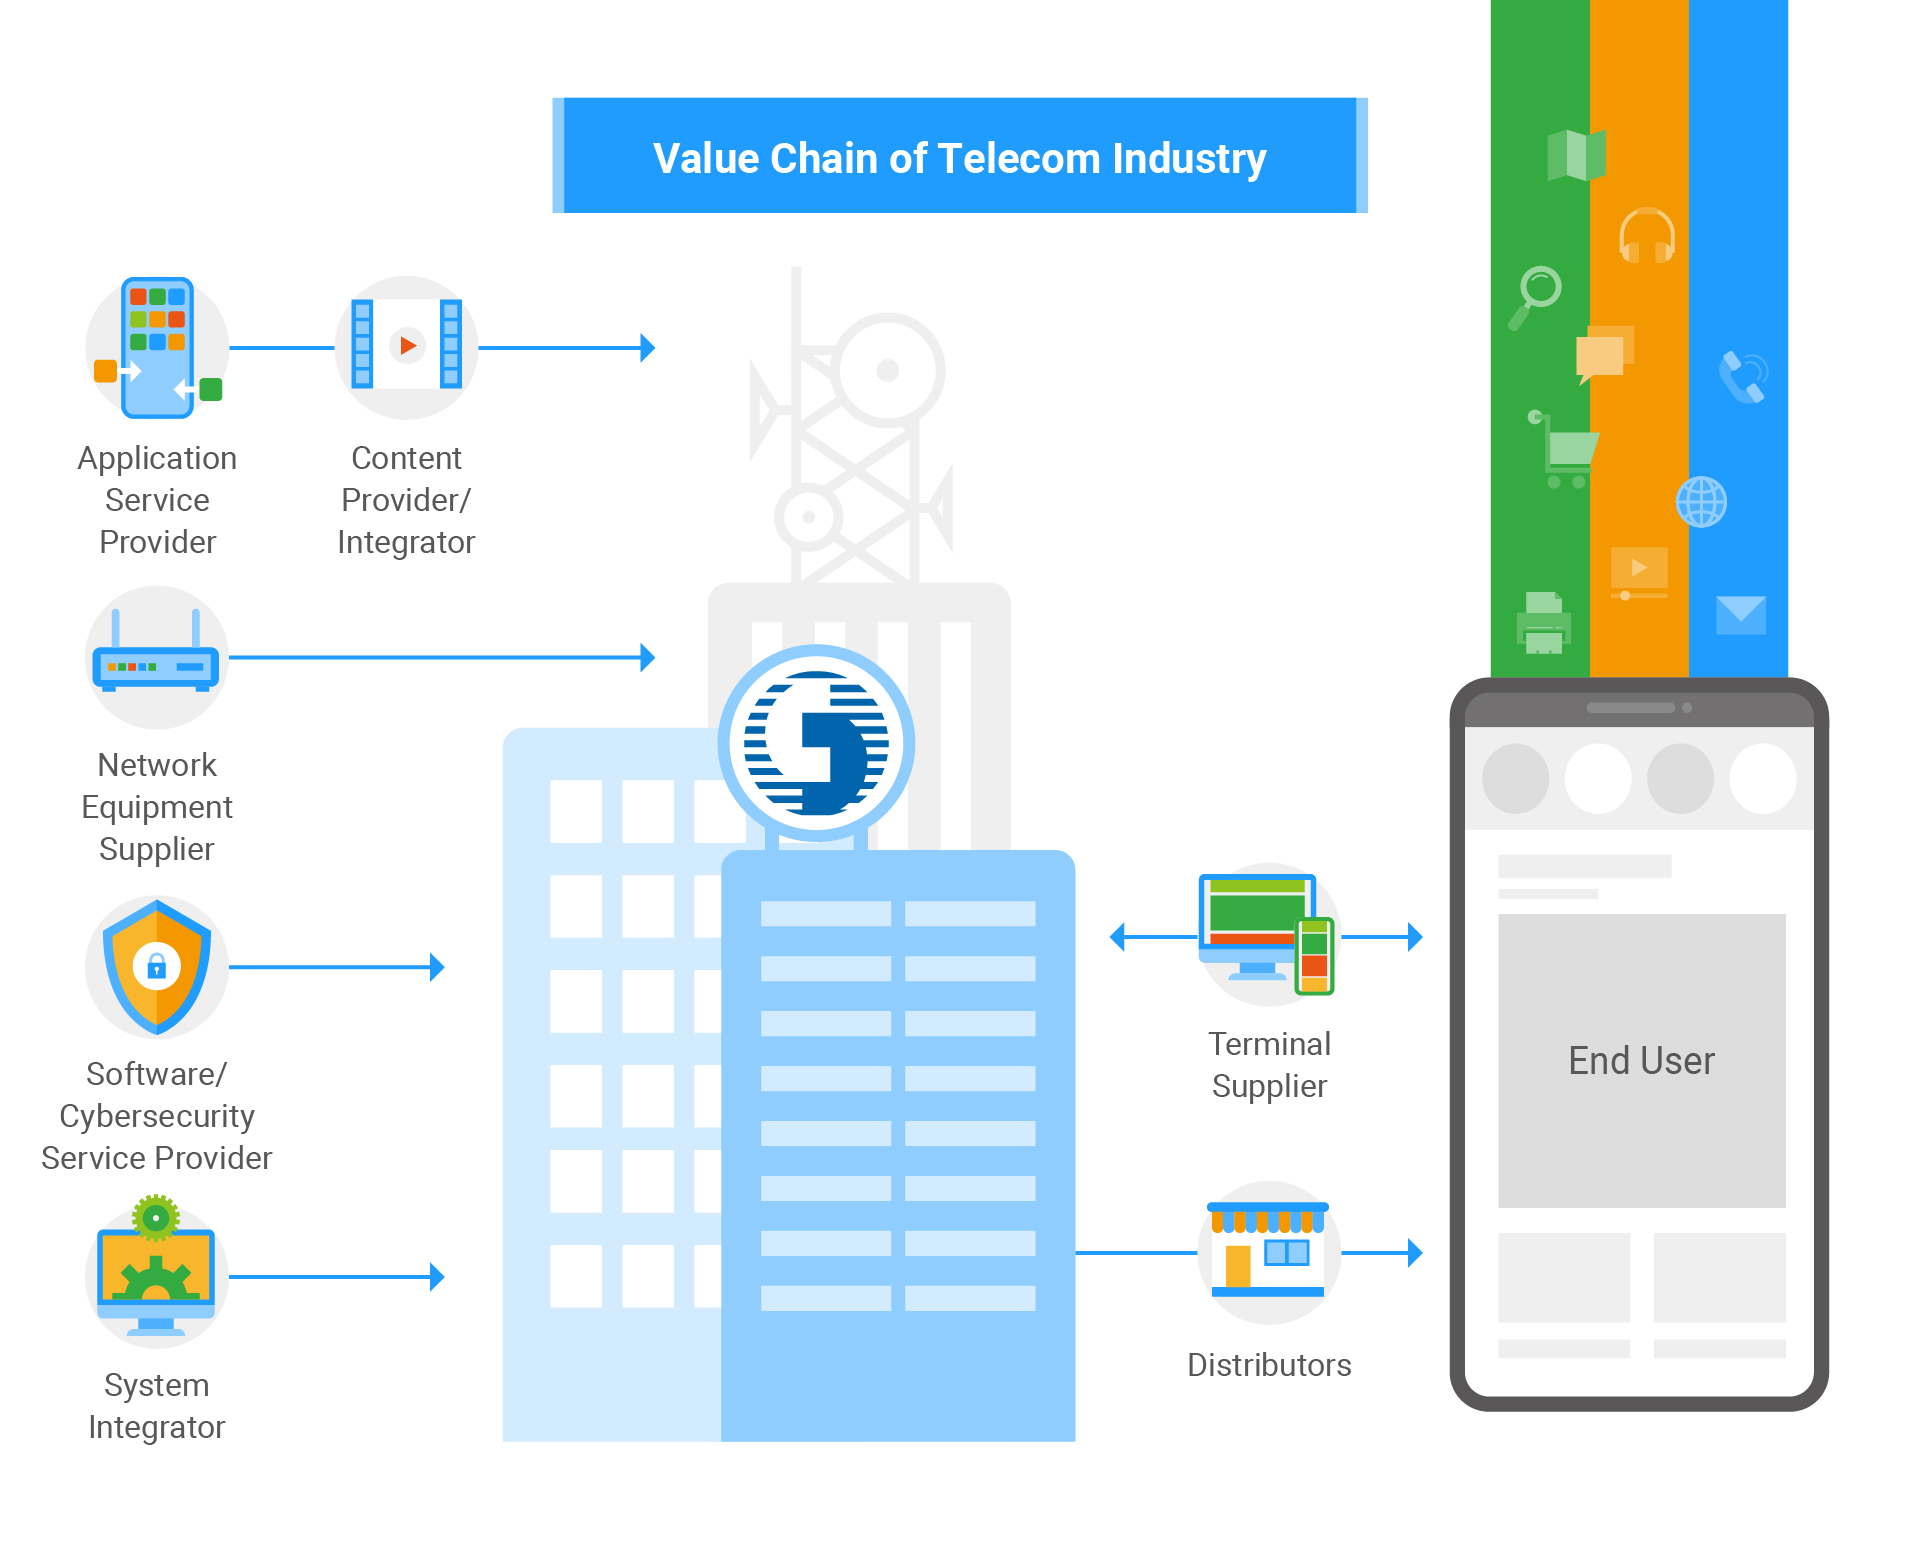
The value chain of the telecom industry is like an interlaced ecosystem, where each element is interdependent and interconnected. Chunghwa Telecom actively participates and plays a leading role in every element across the telecom value chain, ensuring a smooth operation and sustainable development of the entire ecosystem.
As a part of the value chain, the telecom infrastructure provides a solid industrial foundation. Communication services cater to the basic communication needs of the general public, and value-added services supply more diverse and innovative application services. These elements, upstream and downstream alike, are interconnected, constituting the value chain of the telecom industry. The above-mentioned upstream and downstream elements jointly foster the value chain of the telecom industry.
Amidst the wave of digital transformation, content providers/integrators, application service providers, network equipment and terminal equipment suppliers, etc., are indispensable partners for telecom service providers. Hence, exercising the “Extensive Alliance” strategy, Chunghwa Telecom ceaselessly improves the fixed line, mobile, data, and ICT services, as well as partners with upstream, midstream, and downstream suppliers to jointly build a closer industrial ecological chain. Through this partnership model, we are committed to offering more quality services to help the industries in Taiwan to realize digital upgrades and transformation goals.
CHT Supply Chain
The scope of CHT operation is mainly of Taiwan. The supplier partners can be divided into types of property (41%), service (20%), construction (18%), projects and tenders (14%), and other (7%).
Aside from professional network communication equipment to be procured internationally, we substantially put the philosophy of “local procurement” into action to facilitate the development of local economy. The total procurement amounted over NT$70 billion in 2023.The ratio of local procurement at Taiwan was 96% in 2023, the same as in the previous year.

2023 Supply Chain Spend Analysis
| Spend Value (% of total spend) | |||
|---|---|---|---|
| Category | Domestic(%) | Foreign(%) | Total(%) |
| Property | 36.70 | 3.81 | 40.51 |
| Service | 19.64 | 0.06 | 19.7 |
| Construction | 17.88 | 0.00 | 17.88 |
| Projects and tenders | 13.45 | 0.13 | 13.58 |
| Commercially available products | 3.89 | 0.00 | 3.89 |
| Repair | 3.31 | 0.00 | 3.31 |
| Administration | 1.13 | 0.00 | 1.13 |
| Total | 96 | 4 | 100 |